More startups fail than succeed – a hard but inescapable reality that entrepreneurs and venture capitalists have made peace with over time. But, is it possible to reduce the incidence of failure, even if marginally, by taking a different approach to company building? We believe it is and that’s why we’ve developed our proprietary Business Market Fit model, a framework that arms startups with the information and insights they need to build sustainably.
Any entrepreneur out there is familiar with the term Product Market Fit (PMF). Achieving PMF – that moment when a startup successfully creates a product that meets market demand – is often celebrated as a major milestone in the startup universe. As it should be. But, to convert PMF into long-term success, the holy grail is to achieve Business Market Fit.
So, what is Business Market Fit?
Business Market Fit takes PMF a step further by asking the critical question: Will this product, despite its popularity, support a thriving business over the long term? A company may have great customer retention, impressive user growth, and an expanding market, but if it is burning cash at unsustainable rates or has flawed unit economics, it will struggle to scale efficiently.
Let’s consider a simple example. A cardboard box full of Rs 100 notes is on sale for Rs 10. The PMF is unarguable (who doesn’t want Rs 90 for free?). But it has no Business Market Fit. Even if you had access to Scrooge McDuck’s vault, that model wouldn’t last long!

The Business Market Fit model goes beyond measuring user growth and revenue. It takes into account factors such as profitability, marketing efficiency and customer acquisition cost (CAC) among others.
A recent company that we evaluated had customer retention rates of over 80% and yet their growth had plateaued at just 7% year-on-year with annual recurring revenue (ARR) at under $1 million. Despite increasing marketing spends 6X, new customers grew only 2X. This led to a 3X increase in CAC and extended payback periods. The situation suggested that the company’s addressable market was too small for meaningful scale and an in-depth analysis confirmed that the market wasn’t large enough to sustain a profitable business.
The 3 Pillars of Business Market Fit

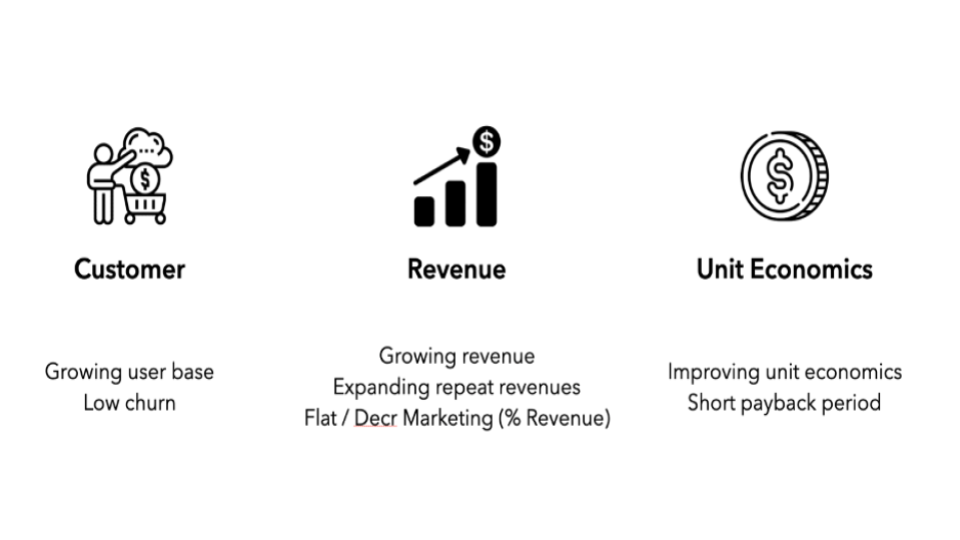
The Lightbox Business Market Fit framework is built on the principle of evaluating companies on three broad metrics – customer, revenue and unit economics.
We focus on these metrics because they define the foundation of a sustainably scalable business. An ideal company achieves continuous customer growth with zero drop-offs, reflecting strong product engagement. Revenue growth should come not only from acquiring new customers but also from increasing spend among existing ones, signaling deeper customer relationships and expanding lifetime value (LTV). Marketing as a percentage of revenue would ideally trend toward zero, indicating organic growth driven by high loyalty. While infinite LTV is an aspirational goal, we emphasize improving unit economics and achieving shorter payback periods, ensuring that each customer contributes to profitability faster.
Though no business can achieve these metrics perfectly or perpetually, they collectively offer the clearest path to understanding how close a company is to the ideal company and vis-a-vis achieving Business Market Fit by balancing growth with sustainable financial fundamentals.
Customer Metrics
There’s no business without customers. Frequent and diligent measurement of customer metrics is critical to understanding whether or not a business is relevant. High product adoption, strong repeat usage and minimal drop-off are some of the key indicators for success.

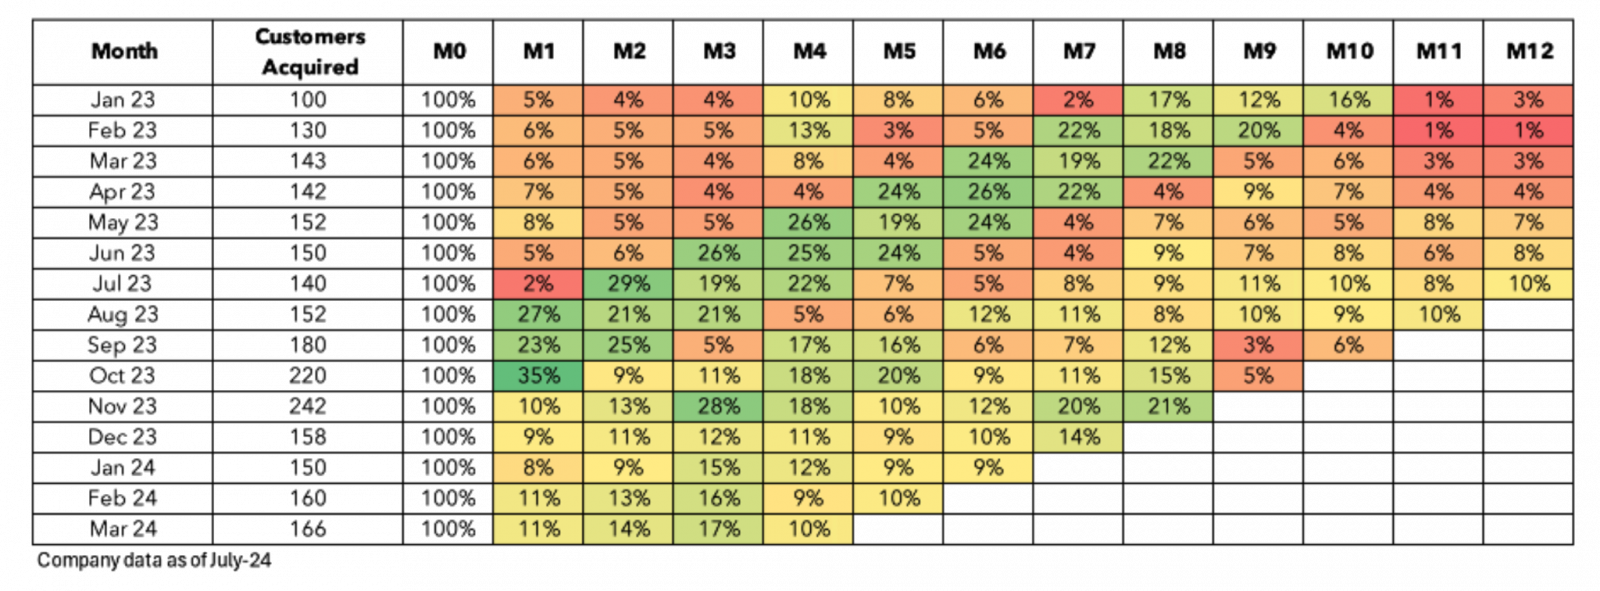
The graphic above is illustrative of what we look for in the monthly customer cohorts of businesses.
- Acquisition: The business shows a consistent upward trend in customer acquisition each month, with a notable spike between September and November. This suggests a strong correlation with seasonal events such as festivals or vacations, particularly in India, driving higher demand during these periods.
- Retention: Retention rates are improving across cohorts, though there’s a noticeable difference between customers acquired before and after August 2023. Despite this variation, the cohorts within each of these periods show consistent performance.
- Churn: An often overlooked metric is the increase in purchase frequency. In the cohort analysis, we see customers shifting from a 4-5 month purchase cycle before August 2023 to a more frequent 3-month cycle after. For example, pre-August cohorts show peaks in months 4, 8, and 12. Post-August, cohorts display a significant portion of customers returning between months 2 and 4.
Revenue Metrics

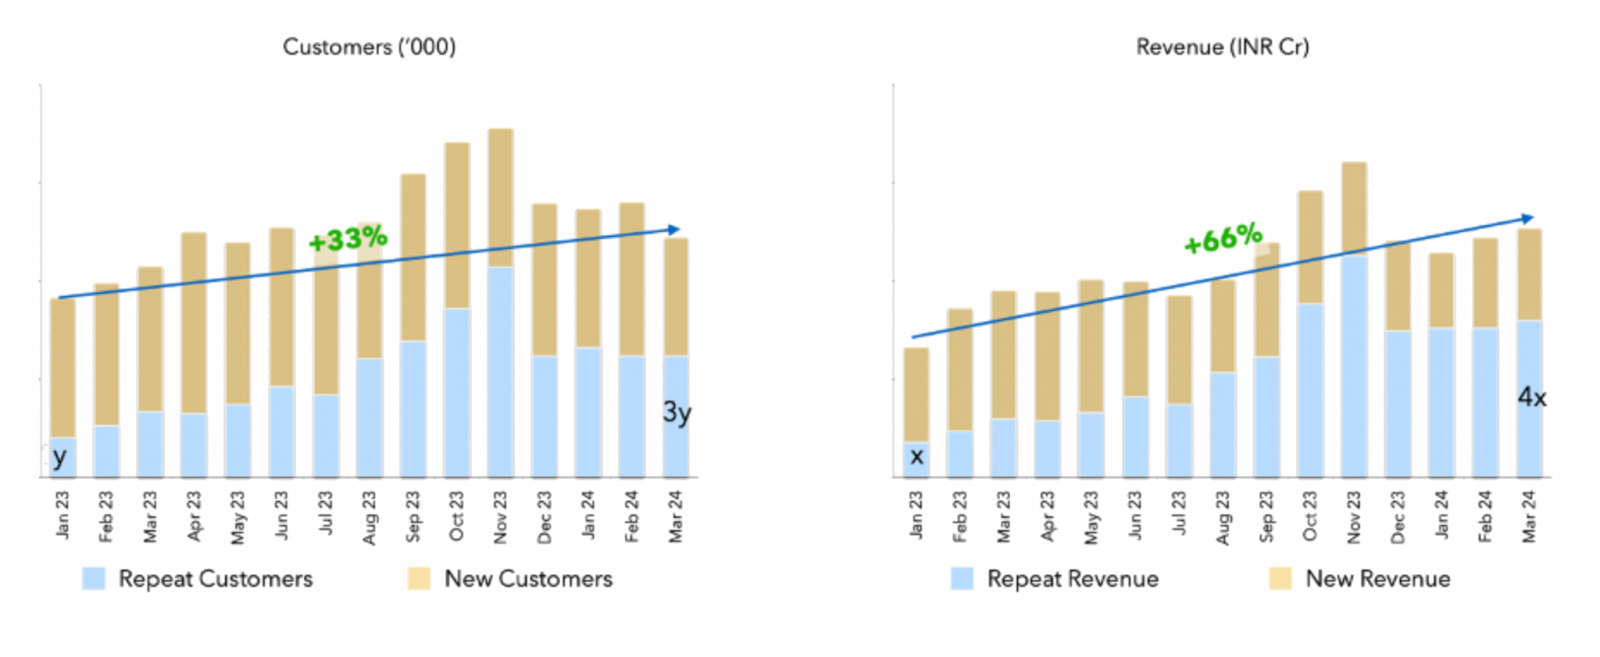
The graphs above illustrate the type of customers interacting with the brand and the revenue generated. We look at these numbers at a high level before diving deeper into understanding what drives each. Here is what we look for:
- Growing total revenue: Total revenue has shown steady growth with a significant peak in November. Although revenue declined after November due to the market’s seasonal nature, the business has still generated higher year-over-year revenue.
- Expanding repeat revenue: This is a key indicator of the quality of growth. While revenue can rise due to factors such as price increases or a surge of new customers, tracking the revenue from returning customers offers deeper insights. In the data above, repeat revenue has grown alongside total revenue, with its contribution steadily increasing, signaling strong customer loyalty.
- Increasing average customer spend: The aim is to get repeat customers to spend more on follow-up purchases. As shown in the data, while the repeat customer count grew by 200%, the revenue from this group increased by 300%, highlighting a significant rise in spending per customer.
Unit Economics

Sustainable growth depends on strong unit economics. This implies keeping CAC low while increasing lifetime value (LTV). In our Business Market Fit framework, we analyze:
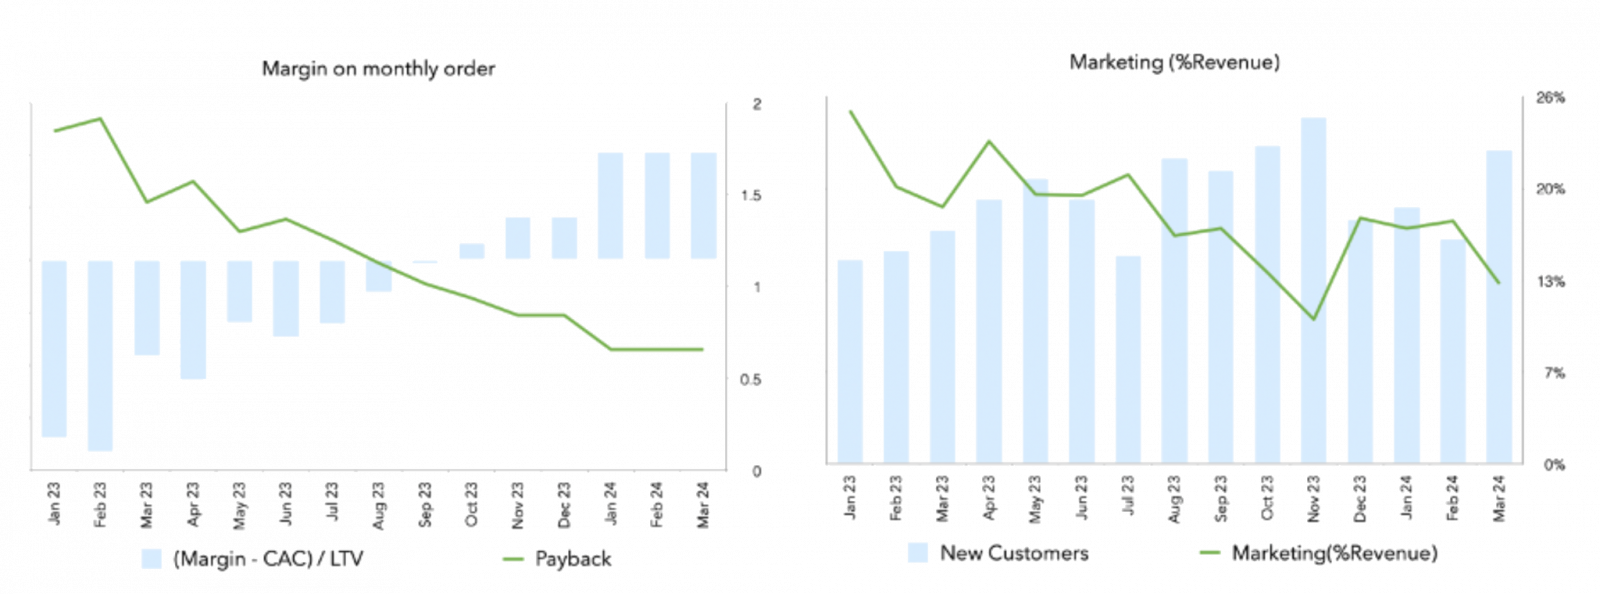
- Improvement in (Margin-CAC): We’d like to see an improvement in either the margin generated by each customer or a reduction in the acquisition cost associated with the customer. As this metric improves, it would imply there is more money left over to cover the fixed costs of the business.
- Reduction in payback time is key: While people often say CAC should be low, that statement lacks context. Instead, we focus on payback time, which measures how many interactions are needed for a brand to recover its CAC. The acceptable payback period varies by product type and industry. For instance, a mattress company with a payback period greater than one year would struggle, since customers rarely buy mattresses frequently. In contrast, high-frequency products or services can support a higher CAC.
- Reducing marketing spend as a percentage of revenue: Over time, we aim to see more efficient marketing and organic growth. While it's challenging to attribute revenue directly to specific marketing efforts (e.g., someone may see an online ad but purchase offline), we measure efficiency by assessing whether each rupee spent on advertising generates more revenue over time. Ideally, marketing as a percentage of revenue should decrease or remain flat as revenue grows and (Margin - CAC) stays positive.
The Path to Efficient Scaling
Scores of startups fail because their business economics break down before they are able to scale. To prevent that scenario, Business Market Fit should be the natural next step after achieving PMF. By focusing on both product desirability and sustainable financial underpinnings, the Lightbox framework helps startups avoid common pitfalls and scale efficiently.
We use a comprehensive scoring system to objectively measure Business Market Fit, assigning companies a score between 0 and 100. This highlights areas of strength and areas for improvement, offering actionable recommendations.
For example, a company with high retention but inefficient marketing would receive tailored advice on how to improve CAC, leveraging customer loyalty to drive organic growth. Similarly, businesses with strong revenue growth but poor profitability would be guided on how to improve margins before scaling too aggressively.
Business Market Fit offers a more nuanced and actionable approach to evaluating a company’s long-term potential. We believe that over time, this approach will help both entrepreneurs and investors to build more predictable businesses and generate superior returns for all stakeholders.
At Lightbox, we believe that true success isn’t just about finding a market for your product; it’s about building a business that thrives within that market. If you're interested in chatting about data analytics or technology in venture capital, reach out to me at monish (at) lightbox (dot) vc.


